As soon as the ocean-bottom seismograph recoveries from the grid were complete we started to prepare for another deployment that wasn’t in the original experiment plan, as we have some time left.
As a facility and as an at-sea team we aim to be flexible and support any science programme to the best of our ability, and so we always bring a bit more “stuff” than we actually need for the original data acquisition plan, so that we can facilitate and accommodate activities such as this.
In this case stuff means ballast weights, batteries for the data loggers, burn wires for the releases and so on.
This is why a blog update has not appeared for a few days! Its been a bit hectic with the team split in two, working two shift patterns – one at night and one during the day.
The night shift primarily released each OBS in turn from the seabed, waiting the 1 ¼ hrs for each to ascend to the surface, before catching them. This process involves the vessel sitting about 800m downwind with the bow pointing towards where we anticipate each instrument to surface.
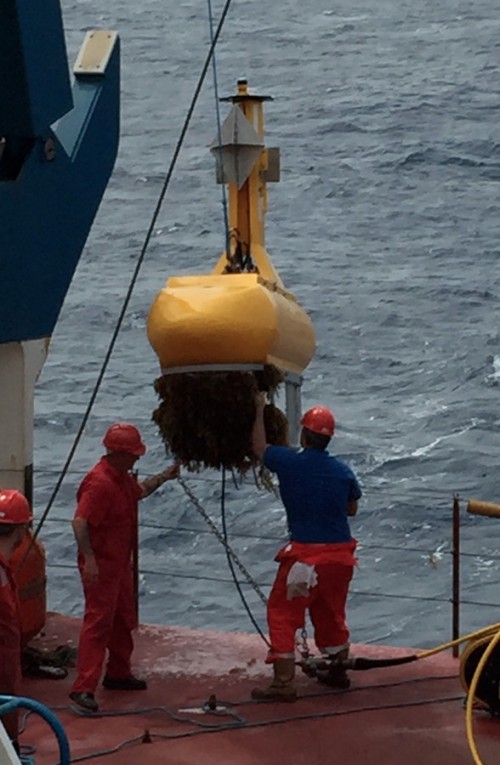
Every work area is different and so we record the recovery location of each OBS as we go along and work out in which general direction the current is taking them as they ascend, and then we adjust the vessel’s waiting position accordingly. In this way, the more recoveries we do, the quicker they get as we can eventually get each OBS popping up just in front of the vessel upwind, which makes it an easy and quick job to move the vessel forward and collect it, by passing it by on the vessel’s starboard side to about mid-ships, where the crew (or if we are lucky we get to have a go) grapple the stray line rope attached to the top of each OBS and lift it out of the water using the starboard gantry crane.
So the night shift primarily did this job, and the day shift stripped the instruments down that we aren’t going to use again, and turned around the 10 that were going to be redeployed. These 10 barely had time to get dry before they were back in the water!
Here is one member of the team removing the data logger from a recovered OBS so that the data can be downloaded and it reprogrammed, ready to reseat the entire instrument on top of a ballast weight already lined up waiting in our working hanger area.
And in between that we download each instrument’s data, convert it to standard format, make some plots and quality control (QC) it. The 10 instruments to be redeployed did the best job during the grid survey on the basis of the QC review – although it has to be said – even though we say it ourselves – all of the data from the primary grid survey is looking very good indeed, and has some very “interesting features” according to the Boss.
We’ll post some of it in a later blog when we summarize what we have achieved not only since we left Mindelo on the 14th January, but since the preparation process started in earnest in May.
So where have we got to by Valentine’s Day?
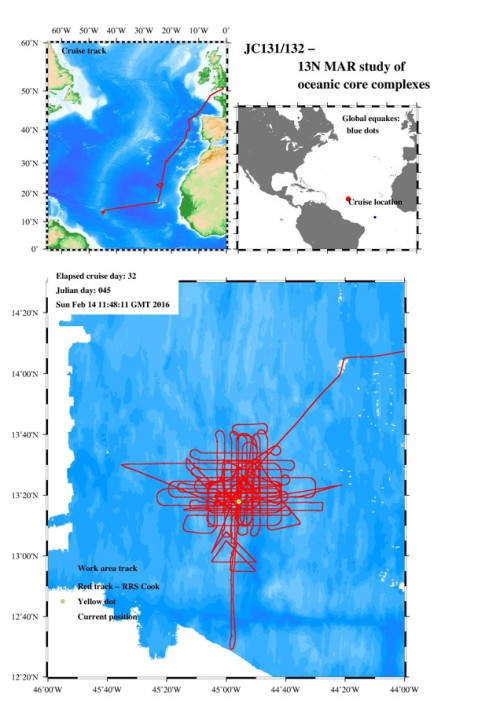
Here is the track chart and you can see where we have put the latest 10 OBS on a N-S trending line in the bottom-middle of this plot. This profile crosses two interesting features – another pair of oceanic core complexes at about 13 deg north – the chevrons show where these features where surveyed using the swath bathymetry system to get a really good look at what the seabed topography is like – and the second is a feature known as a fracture zone.
 Fracture zones are offsets in mid-ocean ridges that allow lateral movement between plates. Basically they are big tears that allow bits of plate to slide past each other to accommodate movement on the Earth as it is spherical and not flat.
Not many fracture zones have been seismically imaged and their structure is still quite a controversial topic. So this is an ideal opportunity to add to the global knowledge base by surveying this one that runs E-W at 12 deg 14’N with modern reflection and refraction seismic technology.
We’ll keep you posted on that.
What else has happened in the days since the last blog?
Well, the multichannel seismic reflection survey in the grid area was completed and the streamer recovered. In each of the three times that we have been to the 13N area, there has always been a lot of floating weed. This weed is proving a pain for the ship’s engineers as it is bunging up the sea water intakes. It also created a rather funny look for the tailbuoy when we recovered it – about a wheelbarrow full had been accumulated in the bump bars underneath the front of the tailbuoy, which took some removal.
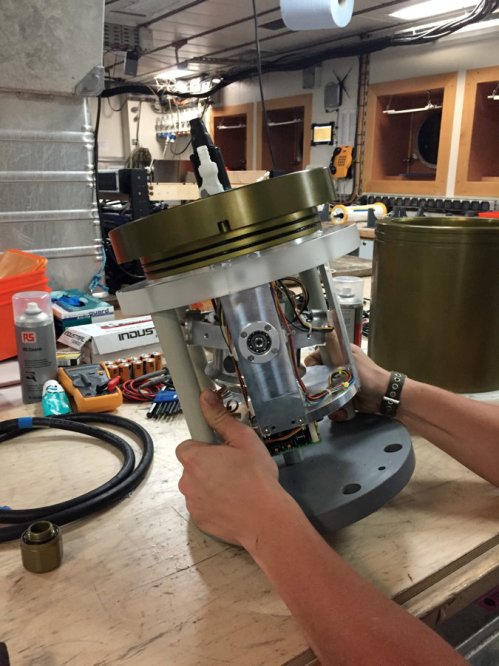
We have also had a chance to look inside our new sensor packages and see how their new gimbals have functioned. We knew the seabed was very undulating in the work area, but we were rather surprised to see just how undulating it over the footprint of our instruments. The gimbal inside one of our new test system locked after landing on the seabed, at an angle of about 30 degrees, as this picture shows. The sensor pressure case is being tilted over by one of the team until the sensor inside, locked in its gimbal, is vertical. This demonstrates the angle the instrument platform must have been at on the seabed.


I’ve been following this fascinating, educational and informative blog but have resisted until hearing that the QC on the recovered OBS data shows more than promise in the recorded data to comment. I’m glad to see the complexity of the project with the associated intellect and investment being tackled in what appears to be a well rehearsed, coordinated and professional manner. Congratulations to all from those who had the vision to promote the experiment to those who are conducting it in the field as it were. And immediately to those who are producing the blog its been an excellent read and brings the activities on board RRS James Cook to life. Plus the background prior to this immediate expedition gives a good insight into the science of geophysics.
LikeLike